Consumption Of Base Oil - Insights On Base Oil Consumption In The Middle East
What Drives The Demand For Base Oil In Various Industries?
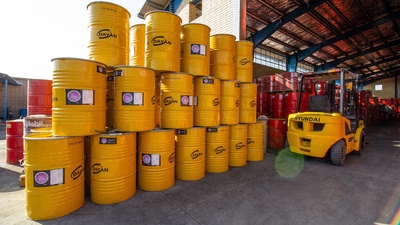
Base oil production is crucial for lubricant industries in Asia.
The primary consumer of base oil is the lubricant industry, which encompasses various sectors such as automotive, industrial, marine, aviation, and others. The demand for base oil is closely tied to the demand for lubricants, which is influenced by factors like industrial growth, vehicle sales, machinery usage, and maintenance requirements. The automotive industry is a significant consumer of lubricants and, consequently, base oil. The demand for base oil is linked to the number of vehicles on the road, vehicle production, and vehicle maintenance needs. The industrial sector relies on lubricants for the smooth operation of machinery and equipment. Manufacturing, construction, mining, and other industrial activities drive the demand for base oil in the production of industrial lubricants.
It is one of the most important raw materials for industry and automobiles. This type of oil is the most widely used raw material for industry and constitutes engine oils and industrial lubricants. Base oil is the name given to first-class lubricating oils. The method of preparation of these oils is first produced by refining crude oil or through chemical synthesis. This substance can be obtained from oil and non-oil sources, but this substance is produced from oil refineries. Oil in the world for lubrication is increasing day by day. For one of the applications of this type of material, he mentioned turbine oil, more than 99% of it is this oil.
Base oils are used to make products such as lubricants, engine oils and metalworking fluids. Different products require different oils and compounds. One of the most important factors is the viscosity of the liquid at different temperatures. Whether or not the crude oil is suitable for preparation in the base oil is determined by the concentration of the base oil molecules as well as the ease of extraction. The base oil is produced using crude oil refining. This means that the crude oil is heated in order to heat the possibility of different distillations from each other. Chemicals - Additives - are added to the base oil in order to meet the quality needs of the final products in terms of, for example, friction and cleaning properties. Certain types of engine oil contain more than twenty percent additives.
During the heating process, light and heavy hydrocarbons are separated - lighter ones can be refined to make gasoline and other fuels, while heavier ones are suitable for bitumen and base oils. There are many crude oils around the world that are used to make base oils. The most common is a type of paraffin crude oil, although there are also petroleum oils that produce products with better solubility and excellent properties at low temperatures. Using hydrogenation technology, in which sulfur and aromatics are removed using high-pressure hydrogen, you can obtain very pure base oils, which are suitable in cases where the quality requirements are particularly precise.
Market trends, such as the shift towards high-performance lubricants, environmentally friendly lubricants, and synthetic lubricants, can influence the demand for specific grades of base oil. Changing regulations, industry standards, and consumer preferences also shape the demand for base oil. The demand for base oil can vary across different regions due to variations in industrial activities, economic development, and infrastructure growth. Emerging economies with rapid industrialization and urbanization often experience increased demand for base oil. The adoption of recycling and re-refining processes can impact the demand for base oil. Re-refined base oil, produced by processing used lubricants, offers an environmentally sustainable alternative and can influence the demand for virgin base oil.
Base oil is primarily consumed by the lubricant industry, which includes automotive, industrial, marine, and aviation sectors. Its demand is closely linked to lubricant consumption, driven by factors such as industrial growth, vehicle sales, and machinery maintenance. The automotive sector significantly influences base oil demand due to the number of vehicles on the road and their maintenance needs. Industrial activities like manufacturing and construction also rely heavily on lubricants derived from base oil. Base oil is produced through refining crude oil or chemical synthesis and serves as a key raw material for engine oils and industrial lubricants. The production process involves heating crude oil to separate lighter hydrocarbons for fuels while heavier ones are refined into base oils. Additives are incorporated to enhance properties like friction resistance and cleaning capabilities. Market trends indicate a growing shift towards high-performance and environmentally friendly lubricants, affecting specific base oil grades" demand.
Regional variations in industrial activity and economic development influence base oil consumption patterns, with emerging economies experiencing increased demand due to rapid urbanization. Additionally, recycling processes for used lubricants are gaining traction, providing sustainable alternatives that may impact virgin base oil demand. "
Base oil is a crucial component in the formulation of lubricants, primarily derived from refined petroleum. It constitutes over 95% of most lubricants, including motor oils and hydraulic fluids. The refining process yields base oils with desirable properties such as high viscosity index, thermal stability, and oxidation resistance, which are essential for reducing friction and protecting machinery. Base oils can be categorized into five groups by the American Petroleum Institute (API), ranging from less refined to specialty oils. While most base oils are petroleum-based, synthetic alternatives like polyalphaolefins and esters are gaining popularity due to their superior performance in extreme conditions. The increasing reliance on base oil in lubricant efficiency highlights its significance in the industry.
West Asia, particularly the Middle East, is a crucial hub for base oil production due to its vast crude oil reserves and advanced refining infrastructure. Saudi Arabia leads the region with its extensive refining capabilities, primarily through Saudi Aramco, which produces various grades of base oils. The UAE follows closely, with significant contributions from ADNOC and ENOC, focusing on high-quality base oils. Iran also plays a vital role in this sector, leveraging its historical oil production and refining expertise through the National Iranian Oil Company (NIOC). Other countries like Kuwait, Qatar, and Oman are also notable producers, each with their own state-owned entities managing oil production and refining. The region"s strategic location and investments in modern refining technologies ensure a steady supply of base oils to meet both regional and global demands. Base oils produced in West Asia adhere to international certifications such as ISO 9001 and ISO 14001, ensuring quality standards are met. The complexity of producing engine oils involves not just base oils but also various additives that enhance lubrication properties.
As the industry evolves, new standards are being developed to optimize fuel efficiency and reduce engine wear. "
Base oils have a rich history dating back to ancient civilizations, where lubricants were derived from animal fats and vegetable oils. The modern era of base oils began in the 19th century with the rise of the petroleum industry, driven by significant oil discoveries and advancements in refining techniques. Initially, crude oil-based lubricants were not favored due to their inferior performance compared to animal-based options. However, as automobile demand surged, manufacturers began optimizing crude oil processing to produce better lubricants. By the early 20th century, engine oils were classified by viscosity, leading to a focus on refining for improved efficiency. The American Petroleum Institute established a classification system for base oils based on refining methods and properties. Over time, innovations such as solvent extraction and hydroprocessing enhanced base oil quality. The introduction of synthetic base oils in the mid-20th century marked a pivotal shift in lubricant technology, offering superior performance for various applications including automotive and industrial uses. Today, ongoing research aims to develop environmentally sustainable base oils that meet modern engine requirements.